
DATA / FDE / Foundry project / 2026
From business data to visual intelligence
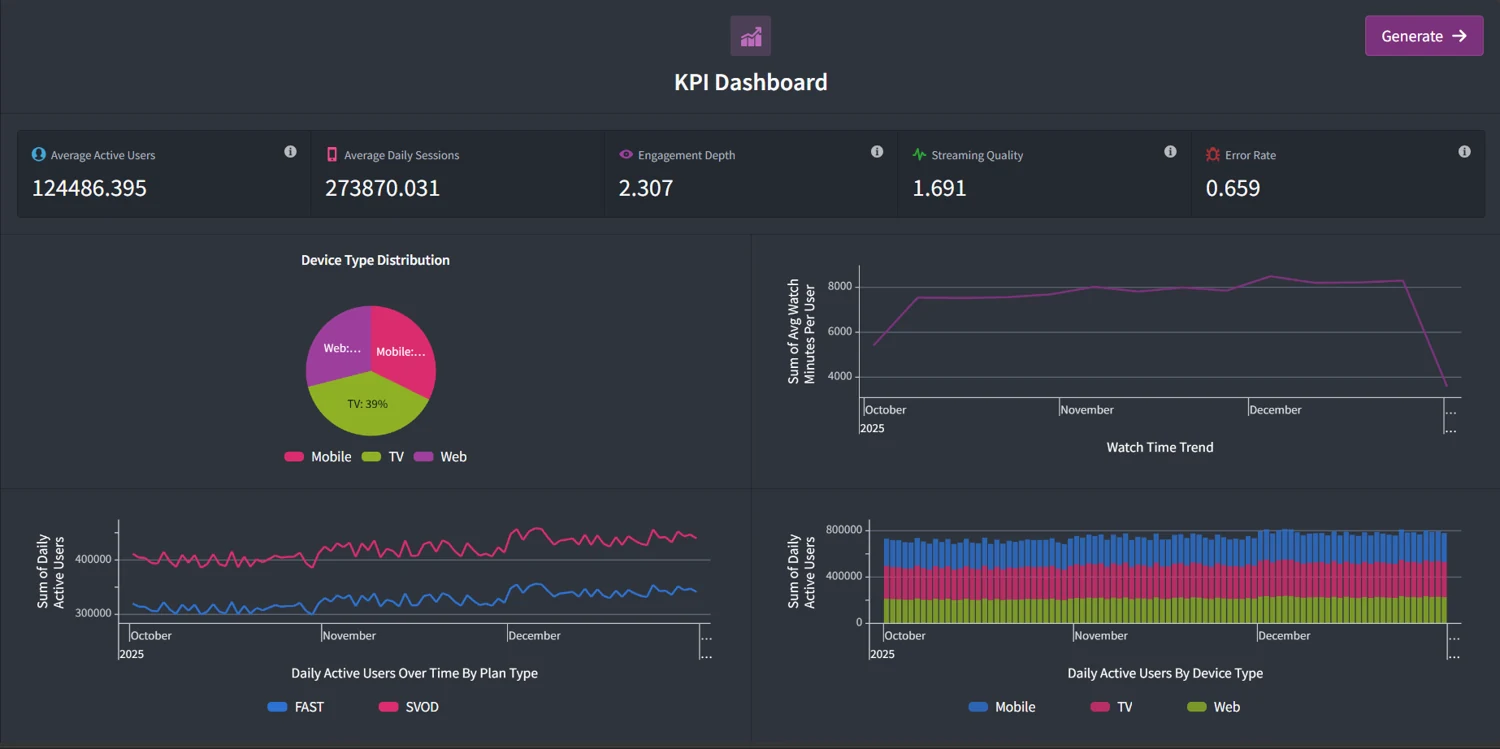
An enterprise KPI dashboard with a conversational infographic workflow and generation history.
ENGINEERING PERSPECTIVE
Inside the work
Bridge enterprise analytical data and a question-led interface: make operational trends understandable while preserving the distinction between a dashboard observation and a verified AI answer.
- Foundry / Ontology
- The supplied CV describes transformations and an Ontology-backed analytical context.
- AIP Logic / Gemini
- The CV supports the AI integration; approved screenshots show the prompt and infographic/history interface, not the model internals.
Prepare analytical context
Dataset transformations and Ontology work are described in the supplied professional evidence.
- Data grounding
- A generated explanation should remain tied to the underlying measures, definitions and time window.
- Workflow design
- Analytical views and question entry provide complementary routes into the same business context.
- Evaluation boundary
- Visible interface evidence does not establish numerical fidelity, retrieval design or backend reproducibility.
What the demonstration establishes
The page demonstrates approved interface evidence and an authored workflow explanation. It does not run Foundry, send prompts to Gemini or claim measured model quality.
Evidence behind this page
Supplied CV and two explicitly approved, privacy-reviewed screenshots. No company data or platform credentials are included.
What it is
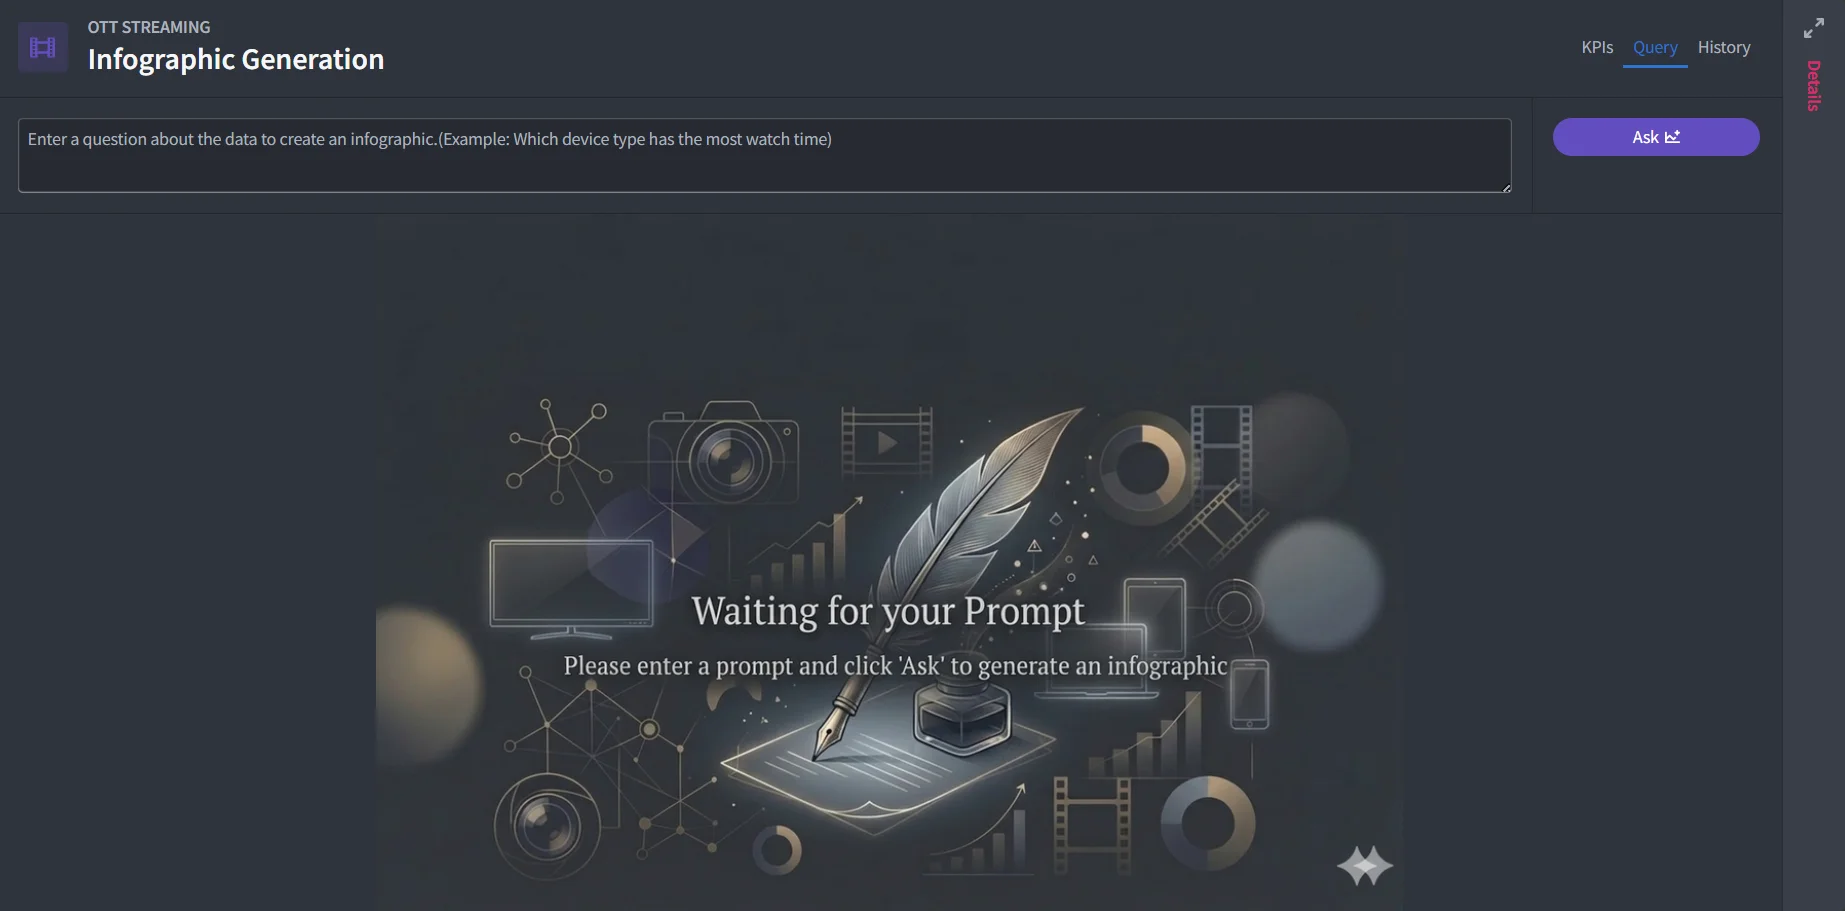
A Foundry project exploring OTT streaming KPIs and presenting business questions through an infographic-generation interface. Supplied screenshots show the dashboard, prompt view, generated analysis and previous-generation history.
Why it was built
Connect analytical business data to an understandable dashboard and natural-language infographic workflow.
My contribution
Independent project described in the supplied CV. Screenshots establish the interface and observed workflow; the CV supports transformation, Ontology, AIP Logic and Gemini work. No company source or internal NCT material is used.
How it works
The CV records dataset transformations, Ontology workflows, AIP Logic for natural-language interactions and Gemini integration for infographic summaries. The screenshots support the visible user workflow; an exported application or model-call trace was not supplied.
- 01Business data
- 02Foundry transforms
- 03Ontology
- 04Prompt workflow
- 05Infographic history
Technical implementation
- The dashboard exposes engagement and streaming-quality KPIs alongside time-based charts.
- Dataset transformations feed the Ontology-backed analytical view, according to the supplied CV.
- The prompt interface accepts business questions and exposes a generated-infographic/history workflow. Two privacy-reviewed images are retained; other images containing run/user identifiers are excluded.
- No backend export, live model trace or deployed demo is represented as available.
Related applied FDE work
Retained planning demonstration notes describe fill-rate and variance views, production adjustments and weekly reporting. Those notes support the intended workflow, not independently verified platform execution.
Explore the planning workflow study View the original Foundry training documentsVisual evidence
Results & evidence
- Two privacy-reviewed screenshots document the dashboard and prompt interface.
- Visible KPIs include active users, sessions, engagement depth, streaming quality and error rate.
Engineering challenges
An AI-generated summary needs grounding in trusted analytical context. Screenshots cannot independently establish retrieval, model-call implementation or correctness.
Scope & limitations
Presented as an evidence-based case study. Backend configuration and model behaviour cannot be reproduced from screenshots, and no performance metrics are claimed.
What I learned
How enterprise data modelling and a usable analytical interface connect to an applied AI workflow.
What I would improve now
Add a shareable platform export or approved technical walkthrough, define evaluation cases for numerical fidelity and document access-control and failure behaviour.