
AI & ML / Eduvos · ITDAA4 / 2026
Finding patterns in student performance
Find engagement patterns and compare pass/fail models while keeping feature selection and preprocessing inside training-only pipelines.
ENGINEERING PERSPECTIVE
Inside the work
Separate descriptive pattern finding from prediction. The notebook explores engagement groups, then asks whether a classifier can predict pass/fail without being handed the outcome through leaked features.
- pandas / NumPy
- Inspect tabular features, missingness and analytical summaries.
- scikit-learn
- K-Means/PCA for segmentation; pipelines for train-only imputation, encoding, feature selection and classification.
Inspect and segment
Explore academic engagement, scale clustering features and use PCA to inspect the resulting groups.
- Data leakage
- student_id, final_score and performance_category are excluded; preprocessing is fitted after the split, using training rows only.
- Unsupervised vs supervised
- Clusters describe feature-space structure. They are not pass/fail labels or evidence of predictive validity.
- Class-aware evaluation
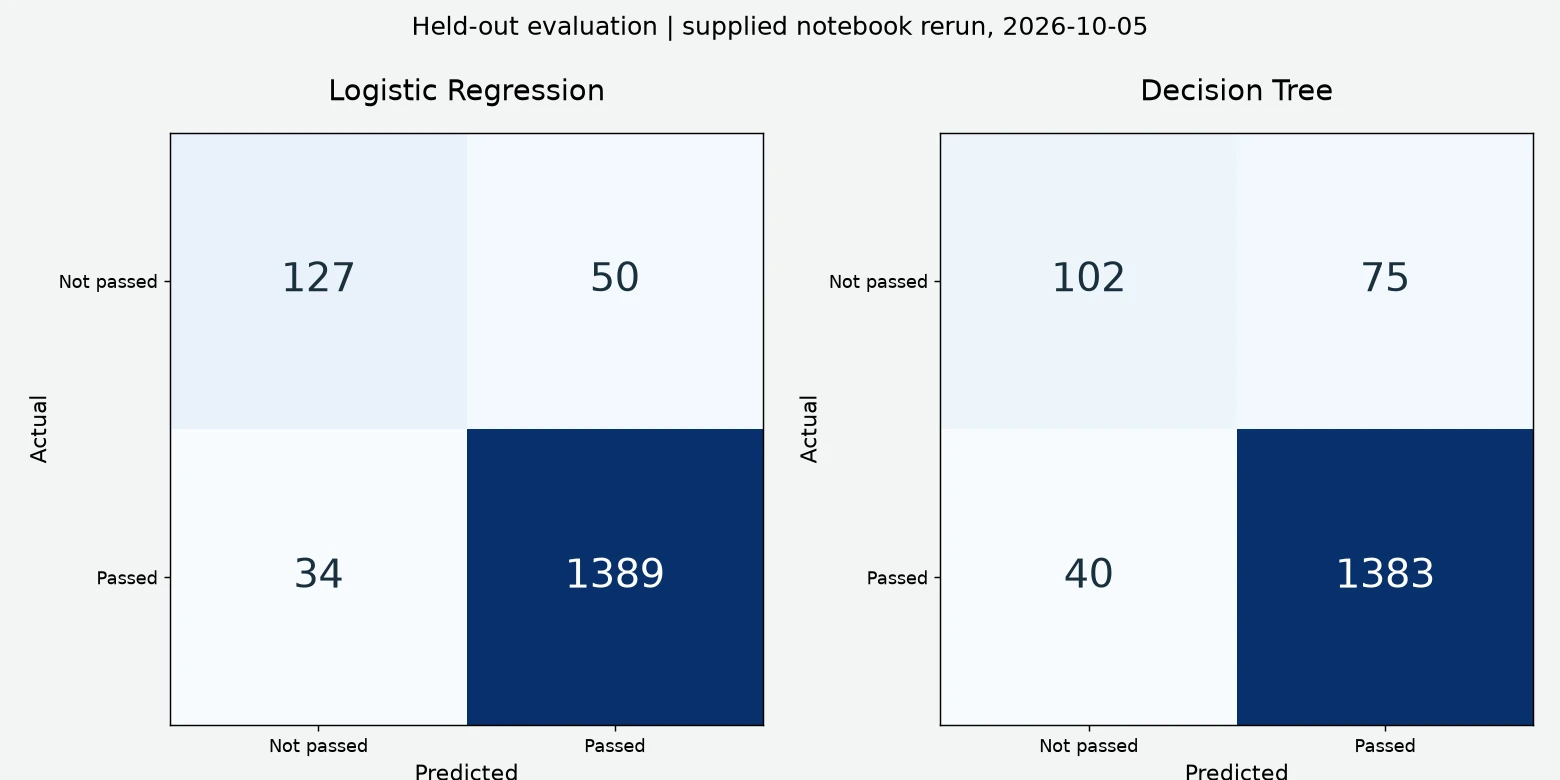
- The positive class is passed. High positive-class F1 can coexist with weaker detection of the failing minority.
What the demonstration establishes
The analytical view compares aggregate confusion counts and metrics. No individual student records are exposed, and a coursework split is not validation for real educational interventions.
Evidence behind this page
Named/commented notebook and fresh local execution. Public code and aggregate results exclude raw CSVs pending provenance confirmation.
What it is
Analyse tutorial attendance and academic performance, segment students with clustering, and compare pass/fail classifiers on a separate AI-usage dataset.
Why it was built
Investigate academic engagement patterns, then compare classification approaches using a separate AI-usage dataset.
My contribution
Individual named/commented notebook, including exploratory analysis, clustering and supervised pipelines. Raw CSV provenance remains unconfirmed and the data is excluded from public publication.
How it works
Use scaled K-Means features and PCA for segmentation. For classification, remove identifier/outcome leakage columns, split 80/20 with stratification, and fit imputation, encoding and SelectKBest inside training pipelines. Compare Logistic Regression and a depth-limited Decision Tree.
- 01Clean data
- 02EDA / segmentation
- 03Stratified split
- 04Train-only preprocessing
- 05Compare classifiers
Technical implementation
- Academic analysis uses 1,348 records; the separate AI-usage dataset contains 8,000 rows and 26 columns.
- K-Means candidates span k=2..8, with k=2 used in the notebook; scaling and PCA support the cluster interpretation.
- A stratified 80/20 split with random_state=42 precedes training-only imputation, categorical encoding, scaling and SelectKBest(k=15). student_id, final_score and performance_category are excluded from classifier inputs.
- Logistic Regression and a Decision Tree with max_depth=5 are evaluated on the same held-out split. The positive class is passed.
Analytical case study
Genuine aggregate results from the reproduced notebook. Passed is the positive class; only 177 test examples failed versus 1,423 passed. Overall accuracy and positive-class F1 do not establish equally good failure detection. No student-level records are exposed.
Data contracts and missing values
, academic_year, gender, qualification, study_level, modules, module_credits, grade_average, modules_passed, pass_rate, passed_all_modules, tutorial_classes_attended, tutorial_class_modules
Missing cells: 11. grade_average: 3 · tutorial_classes_attended: 4 · tutorial_class_modules: 4
student_id, age, gender, grade_level, study_hours_per_day, uses_ai, ai_usage_time_minutes, ai_tools_used, ai_usage_purpose, ai_dependency_score, ai_generated_content_percentage, ai_prompts_per_week, ai_ethics_score, last_exam_score, assignment_scores_avg, attendance_percentage, concept_understanding_score, study_consistency_index, improvement_rate, sleep_hours, social_media_hours, tutoring_hours, class_participation_score, final_score, passed, performance_category
Missing cells: 2708. ai_tools_used: 1362 · ai_usage_purpose: 1346
Column names and aggregate missing-cell counts only. Input provenance/redistribution remains unresolved. Train-only imputation, encoding, scaling and SelectKBest avoid fitting preprocessing on the test data. Target-derived fields and student_id are excluded from predictor inputs.
Results & evidence
- Fresh local execution reproduced 94.75% Logistic Regression accuracy and 92.8125% Decision Tree accuracy.
- Rounded historical positive-class F1 scores: 0.971 and 0.960 respectively.
Engineering challenges
Direct outcome columns can leak the target. Strong positive-class scores in an imbalanced dataset can obscure poor detection of the smaller failing class.
Scope & limitations
The positive class is “passed”; these F1/recall values do not directly describe detection of students needing support. A single held-out split is not external validation. Raw datasets remain local pending provenance review.
What I learned
Treat preprocessing as part of the model, interpret metrics in their class context and separate segmentation from predictive validation.
What I would improve now
Record original dataset sources/licences, add cross-validation and class-aware reporting, inspect subgroup performance and avoid operational decisions from an unvalidated coursework model.